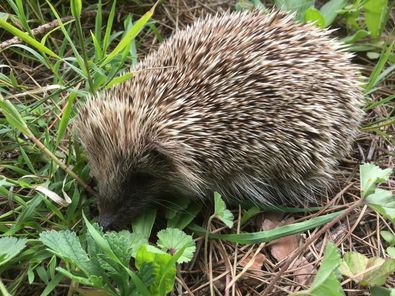
We all look for signs of spring, whether it’s the song of birds at dawn, the smell of the first cut of grass or just the drive home from work in the light. But there’s another sign of spring that I always note, though never look forward to. Spring marks the beginning of squashed Hedgehog season. Road kill, sad though it always is to see, is an important source of information on mammal distribution. At one time I only recorded a mammal if I thought there was something particularly interesting about it, but for over a decade now I’ve been noting almost every mammal or mammal sign that I encounter and road kill makes up by far the majority of my records. In most cases I only record the mammal if it is in a location where I haven’t recorded that species before. However, if recorded systematically, road kill can also provide useful data on relative abundance and population change. The Hedgehog in particular is a species where there is a great deal of concern over its apparently declining population, not least due to the impacts of cars and there are questions as to the sorts of places where they are killed on roads. In recent years I have tried to record every single road kill Hedgehog that I see, regardless of whether I have seen one in that location before, to help answer these questions.
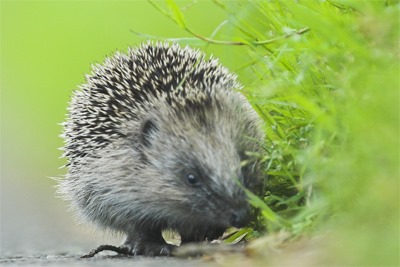
(thanks to Martin Kitching for the use of the photo)
In 2019, I recorded a total of 123 road casualty Hedgehogs across the North East, compared to 104 in 2018 and 107 in 2017. I could probably dig out some older spreadsheets and go back a little further still, but regardless of the fact that I rarely travel in the North East outside of the Tees Valley and that my travel habits across those years are quite similar, that is obviously not a standardised sample.
What is a lot more standardised is my daily workplace commute. In late 2015 I started a new job in Kirkleatham which involved a new driving route. Once the “squashed Hedgehog season” started the following spring, I noticed that part of the route seemed to have particularly high levels of Hedgehog mortality. Recording all road casualties isn’t as easy as it might seem; it’s not always obvious whether the dead Hedgehog that you saw on Monday is the same one that you saw the previous Friday and, as dead Hedgehogs tend to stay put, it can get confusing. Unfortunately, in 2016 I lost track and couldn’t be sure just how many I had counted, so that year’s data was deficient, at least as far as providing a baseline was concerned. In subsequent years I’ve become a bit more obsessive and am pretty sure that I avoided the opposing perils of undercounting and double counting.
In 2019, between my doorstep in Darlington and my workplace in Kirkleatham, I counted 57 Hedgehogs as road casualties, compared to 37 in 2018 and 42 in 2017, which averages approximately 46 individuals per year. My commute to work is around 24 miles so that equates to roughly two dead Hedgehogs per mile of road per year, or 1.2 per kilometre. If that was replicated across England’s road network then that equates to a lot of dead Hedgehogs, but what I found particularly interesting is that there are big differences in the numbers of Hedgehogs killed on the various sections of road.
Table 1 below divides my commute up into different sections of road based on the habitats that dominate each section to a minimum of at least 200m on either side of the road. Apart from a very short section on one side of the A19 where a wall separates the from some housing at Whinney Banks in Middlesbrough, there did not appear to be any barriers to Hedgehogs accessing the roads or crossing from one side to another.
Table 1. Road sections
| Start and finish points | Adjacent habitats | Distance | |
| 1 | Salters Lane North- Bishopton Lane NZ297172 – NZ320165 | Urban/ suburban | 2.25km |
| 2 | Bishopton Lane – A66/ A135 Yarm Road junction. NZ320165 – NZ430170 | Rural – mostly arable | 11.5km |
| 3 | Yarm Road – A19 NZ430170 – NZ473188 | Light industrial/ urban | 5km |
| 4 | A19 – A174 NZ473188 – NZ468152 | Arable fields | 4km |
| 5 | A174 – Greystones NZ468152 – NZ568193 | Suburban | 11.5km |
| 6 | Greystones – Kirkleatham Lane NZ568193 – NZ590212 | Amenity landscaping/ golf course | 3km |
| 7 | Kirkleatham Lane NZ590212 – NZ591219 | Woodland strip/ arable | 0.75km |
| 8 | Business Park NZ591219 – NZ590225 | Amenity landscaping | 0.5km |
Table 2 shows the mean of the total number of Hedgehogs killed per kilometre per year, across each section of road over the three years 2017-2019. It also shows the number of Hedgehogs killed on each section of road each year.
The figures for 2016 have been added to show the pattern of road casualties, which fits well with those from subsequent years. Hedgehog casualties in 2016 were recorded on these sections of road up to the end of August that year and only a very small number, if any, will have been missed prior to that, so the total for that year can be reasonably estimated to have been in the low thirties.
Table 2. Hedgehog casualties per road section.
| Adjacent habitats | Mean no. HH/km/yr 2017-2019 | No. HH 2016 (incomplete) | No. HH 2017 | No. HH 2018 | No. HH 2019 | |
| 1 | Urban/ suburban | 2.1 | 3 | 2 | 2 | 10 |
| 2 | Rural – mostly arable | 0.4 | 4 | 7 | 4 | 4 |
| 3 | Light industrial/ urban | 0.6 | 3 | 2 | 1 | 6 |
| 4 | Arable fields | 0.1 | 0 | 0 | 0 | 1 |
| 5 | Suburban | 2.3 | 13 | 25 | 23 | 30 |
| 6 | Amenity landscaping/ golf course | 0.7 | 1 | 3 | 2 | 1 |
| 7 | Woodland strip/ arable | 4.8 | 1 | 3 | 5 | 3 |
| 8 | Amenity landscaping | 1.3 | 1 | 0 | 0 | 2 |
| All | 1.2 | 26 | 42 | 37 | 57 |
The adjacent habitats column consists of very broad categories; at a smaller scale there is much variation and patches of other habitats occur. For example, Section 2 is almost all arable for some distance north and south of the road, but at the eastern end there is a Community Woodland on the north side and the village of Long Newton is nearby at one point. On Section 6, the small village of Lazenby lies closely adjacent to the north.
Hedgehog casualties are not scattered randomly but tend to occur at certain points such that you can almost predict where they will occur. This is particularly noticeable along the long stretch of arable in Section 2 where they appear to be concentrated at road junctions, underpasses or where there are other blocks of habitat such as woodland. I cannot recall a road casualty Hedgehog where only arable fields lay adjacent to the section (which, incidentally, contrasts with the situation for Brown Hare road casualties on the A66).

Is this carnage a problem? My instinctive reaction is one of, how can this level of attrition be sustainable? Instinct isn’t necessarily instructive though and if we take the numbers of dead Hedgehogs as a proxy for the number of live ones then there hasn’t been a reduction in the four years that I have been counting. In fact, in 2019 there was a substantial increase in those sections running through suburban areas. Of course, four years isn’t a long timeframe in which to observe population change but there haven’t been any alterations to the environments surrounding these roads in that period and, as far as I am aware, other than maturing landscaping in sections 5 and 8, no major habitat changes over the past 20-30 years. Therefore the amount of Hedgehog habitat will have remained pretty much the same, so habitat change is unlikely to be a factor in this instance. Of course many other confounding factors will be at play, for example differences in weather patterns between years will affect the numbers of Hedgehogs and the distances that they need to roam to meet their needs but their effects aren’t simple and will be difficult if not impossible to disentangle.
The level of traffic, which is the issue in focus, is unlikely to have changed significantly over the four year study period, but will undoubtedly have increased during that same 20-30 year period. Unfortunately due to the lack of Hedgehog data from earlier years it isn’t possible to correct for this. It may be that the number of dead Hedgehogs per car was much higher in previous years and that my baseline is an already depressed population but if not then road traffic does not seem to be resulting in a reduction in Hedgehog numbers in the areas surrounding these roads. So did the 57 Hedgehogs that died on my route to work in 2019 represent a growing population or would their deaths diminish the 2020 population. Unfortunately the loss of the daily commute due to changes in working practices as a result of the Covid-19 pandemic made the 2020 comparison meaningless. Nevertheless the extreme change in travel patterns resulting in an estimated 60% reduction in road traffic levels over the period when Hedgehogs are most active, does provide an interesting, if unintentional, experiment. It might reasonably be predicted that if road traffic is a major contributor to Hedgehog population declines then such a dramatic reduction in traffic ought to be reflected in an increase in Hedgehog numbers. Sadly I saw my first Hedgehog road casualty of 2021 last week, on the A174. I wonder what the rest of the year holds for them.